How to Use Visual KPIs for Daily Leadership
Daily leadership gets easier when performance is visible.
When KPIs live inside spreadsheets or dashboards that few people open, leaders end up managing by memory, opinions, or delayed reports. Visual KPIs solve that problem by putting the numbers (and the story behind them) where the work happens—so teams can react fast, learn daily, and improve continuously.
In this guide, you’ll learn what visual KPIs are, which metrics to use, how to design a KPI board that actually works, and how to run a simple daily rhythm that builds accountability without micromanagement.
What “Visual KPIs” Really Means
Visual KPIs are key performance indicators displayed in a way that makes status instantly understandable at a glance—no logins, no digging, no interpreting complex reports.
A good visual KPI system does three things:
- Shows target vs actual clearly (and frequently)
- Highlights abnormalities immediately (so you can respond)
- Creates a daily habit of checking, learning, and improving
This is why visual KPIs are so powerful for leaders: they turn performance into a shared team conversation, not a private management spreadsheet.
Why Visual KPIs Improve Daily Leadership
Visual KPIs support daily leadership because they create alignment around facts. When metrics are visible:
- teams know what “good” looks like today
- problems are identified earlier (before they become emergencies)
- accountability becomes natural—because everyone can see the same reality
- leaders spend less time chasing updates and more time removing obstacles
In short, visibility drives better decisions, faster learning, and calmer execution.
Step 1: Choose KPIs That Teams Can Influence Daily
Many KPI systems fail because they track outcomes that teams can’t realistically affect today (or because they track too many things).
Start with KPIs that are:
- actionable (teams can influence them within 24–72 hours)
- frequent (measured daily or per shift)
- simple (clear definition and calculation)
- leading + lagging balanced (signals + results)
Examples of daily-friendly KPIs (pick what matches your workflow):
- On-time delivery / due date hit rate
- Throughput (items completed per day/week)
- Quality (defects, rework, escapes)
- Response time / cycle time / lead time (for service teams)
- WIP (work in progress) and blocked items
- Customer satisfaction signals (tickets reopened, complaints)
Step 2: Define “Target,” “Red,” and “Green” So There’s No Debate
A KPI is only useful when the team agrees on what it means.
For each KPI, define:
- Target: the desired value
- Green: on target (or better)
- Red: off target (clear threshold)
- Owner: who updates it and who escalates issues
- Cadence: how often it’s updated
When red/green thresholds aren’t defined, daily reviews turn into opinions. When they are defined, daily reviews become problem-solving.
Step 3: Design the KPI Board for Fast Reading (Not Decoration)
Visual KPI boards should be readable in seconds. The best design principle is simple:
“If someone walks by, can they tell if we’re winning or losing today?”
A practical KPI board layout often includes:
- Top row: the handful of KPIs that matter most (3–7)
- Target vs actual: side-by-side
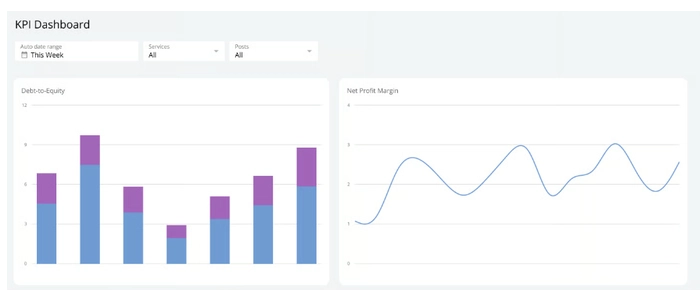
- Trend: a simple 5–10 day run chart (optional but powerful)
- Abnormality notes: quick explanation when it’s red
- Actions: who is doing what by when
Keep it simple and consistent. Complexity creates delay—and delay destroys daily leadership.
Step 4: Build a Daily KPI Review Habit (10 Minutes, Same Time, Same Place)
Visual KPIs only work if they’re used.
A strong daily leadership rhythm looks like this:
Daily KPI Huddle (10 minutes)
- 1 minute: confirm today’s staffing and constraints
- 3 minutes: review KPIs—what’s green, what’s red
- 4 minutes: focus on abnormalities (why is it red?)
- 2 minutes: assign actions and owners
The goal is not to “report.” The goal is to see reality and remove obstacles quickly.
Step 5: Treat “Red” as a Signal, Not a Failure
In high-performing teams, red KPIs are not punishment—they’re information.
A healthy response to red is:
- acknowledge it quickly
- ask what changed
- identify the most likely cause
- take the smallest action that reduces risk today
- capture learning so tomorrow is easier
If people fear red, they will hide problems. If leaders treat red as a learning signal, teams will surface issues early—and performance improves faster.
Common Mistakes (And How to Avoid Them)
- Tracking too many KPIs: start with 3–7, expand only if needed
- KPIs without actions: every red should trigger a next step
- Inconsistent updates: assign owners and a daily time
- Vanity metrics: choose measures that influence decisions
- No trend view: a simple daily line helps you see patterns
Final Thoughts
Visual KPIs are one of the simplest upgrades a leader can make—because they turn performance into a shared reality.
When metrics are visible, teams align faster, problems surface sooner, and leadership shifts from “checking on people” to supporting flow and removing obstacles.
Related reads: