
KPI Boards: How to Track What Actually Matters
A KPI board is one of the simplest tools for turning “numbers” into action.
Instead of tracking metrics in spreadsheets that nobody looks at, a KPI board makes performance visible every day—so teams can spot problems early, align on priorities, and improve faster.
What Is a KPI Board?
A KPI (Key Performance Indicator) board is a visual dashboard—usually physical and placed where the work happens—that shows:
- The handful of metrics that matter most
- Targets vs actual performance
- Trends over time
- Owners and actions when performance drifts
In other words, it’s not just “reporting.” A KPI board is a management system for daily improvement.
Why KPI Boards Work Better Than Hidden Dashboards
Most teams already have data. The problem is the data is invisible—or scattered across tools.
A KPI board fixes that by making performance:
- Public: everyone sees the same truth
- Simple: fewer metrics, clearer signals
- Actionable: triggers a response when performance changes
- Habit-forming: reviewed on a cadence (daily/weekly), not “whenever”
The #1 Rule: Track Outputs and Drivers
Strong KPI boards balance two types of metrics:
- Outcome (lagging) metrics: what you ultimately want (quality, delivery, revenue, customer satisfaction)
- Driver (leading) metrics: what influences outcomes (WIP, cycle time, first-pass yield, on-time start, adherence to standard work)
If you only track outcomes, you notice problems too late. If you only track drivers, you lose the “why it matters.” KPI boards work because they show both.
How to Build a KPI Board That People Actually Use
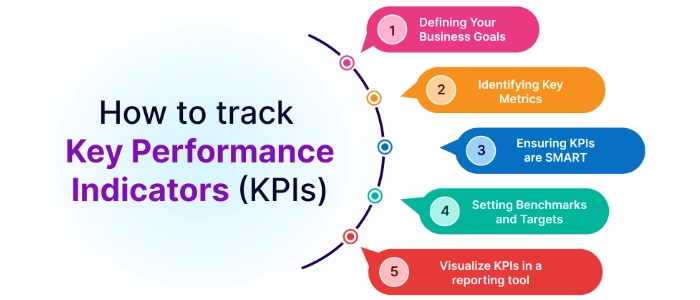
Step 1: Pick 5–9 KPIs (not 30)
If everything is a KPI, nothing is. For most teams, the sweet spot is 5–9 metrics—enough to see the system, not so many that the board turns into wallpaper.
A simple way to choose:
- Delivery: on-time completion, lead time, throughput
- Quality: defects, rework rate, first-pass yield
- Cost/Productivity: output per day, overtime hours, utilization (used carefully)
- Safety/People: incidents, near misses, engagement signal
Step 2: Define the metric precisely
Ambiguous metrics cause endless debate. For each KPI, define:
- Formula: exactly how it’s calculated
- Data source: where it comes from
- Update cadence: daily/weekly/monthly
- Owner: one person accountable for updating and explaining it
Step 3: Set a target and a threshold
A KPI without a target is just a number.
Use simple visual thresholds:
- Green: on target
- Yellow: watch / trending off
- Red: off target / action required
This removes guesswork. Everyone knows when to react.
Step 4: Show trends, not just today
Single-point numbers can mislead. KPI boards should show direction:
- Daily dots/marks for the last 7–14 days
- Weekly trends for the last 8–12 weeks
- A simple run chart when possible
Trends help teams avoid overreacting to normal variation—and focus on real signals.
Step 5: Add an “Actions” area (this is the difference-maker)
If a KPI turns red, what happens next?
Include a small, visible space for:
- Top 1–3 current issues
- Owner + due date
- Next step (not a long plan—just the next step)
- Link to deeper problem-solving when needed
Without this, KPI boards become passive reporting instead of active management.
Where to Place a KPI Board
Place the board where decisions happen:
- In the team area (near the work, not in a conference room nobody uses)
- In a leadership walk path (so it’s naturally reviewed)
- At the start of a daily huddle or shift change
If it’s not visible, it won’t be used.
Example Layout (Simple and Effective)
- Top row: Team name + goal + review cadence
- Left: 5–9 KPIs with target, actual, and trend
- Right: Issues / actions / owners
- Bottom: Notes, wins, learnings
Common KPI Board Mistakes
- Too many KPIs: pick fewer, better metrics
- No ownership: every KPI needs a clear owner
- No cadence: review daily/weekly consistently
- Only lagging metrics: add drivers that predict outcomes
- Tracking without action: “red” must trigger a response
Final Thoughts
KPI boards work because they create a shared, visual truth—and they make improvement part of the daily rhythm.
If you keep your board simple, define metrics clearly, review consistently, and connect red signals to action, you’ll build a system that improves performance without constant firefighting.
Recommended next reads: