
Kanban Metrics That Actually Matter (And Which Don’t)
If you’ve ever felt like your team is “tracking a lot” but not improving much, you’re not alone. The truth is: most Kanban metrics are only useful if they help you make better decisions—faster.
This guide breaks down the Kanban metrics that actually matter (the ones that improve delivery), the metrics that often distract teams, and a simple weekly review routine that turns numbers into real improvement.
What Kanban Metrics Are For (And What They’re Not)
Kanban metrics should answer practical questions like:
- How long will this take?
- How many items can we finish each week?
- Where is work getting stuck?
- Are we overloaded?
Kanban metrics are not for ranking people, pushing “busy-ness,” or proving that everyone is working hard. If your metrics create fear, they’ll create bad data—and bad decisions.
The 5 Kanban Metrics That Actually Matter
1) Lead Time
Lead time is the total elapsed time from when work is requested (or committed) until it’s delivered. This is one of the most important measures because it reflects what customers actually experience.
- Why it matters: It’s the best “reality check” on speed and predictability.
- How to use it: Track lead time trends and percentiles (not just averages).
Want a deeper comparison with throughput?
2) Throughput
Throughput is how many work items you finish in a given time period (per day/week/sprint). Throughput helps you understand capacity and forecast delivery—especially when combined with lead time.
- Why it matters: It tells you how much the system can deliver, regardless of effort.
- How to use it: Track weekly throughput and watch for volatility or bottlenecks.
3) Work in Progress (WIP)
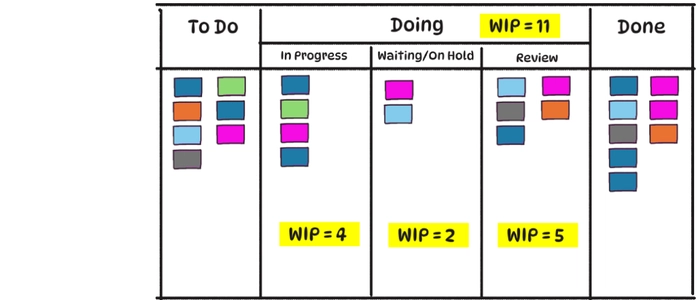
WIP is the amount of work currently in the system (in progress and/or in workflow states). High WIP usually means longer lead times, more context switching, and more hidden queues.
- Why it matters: WIP is one of the few levers that improves flow almost everywhere.
- How to use it: Set simple WIP limits and keep them visible on the board.
4) WIP Age (How Long Work Has Been “Stuck”)
Teams often track how much work is “in progress,” but not how long that work has been there. WIP age measures how long an item has been active without finishing.
- Why it matters: It surfaces stuck work early—before it becomes a crisis.
- How to use it: Create an “aging threshold” (for example: any item older than your typical lead time gets attention).
5) Flow Efficiency
Flow efficiency compares touch time (active work) vs total elapsed time (including waiting). Many systems have surprisingly low flow efficiency because work spends most of its time waiting.
- Why it matters: It shifts focus from “work faster” to “remove waiting.”
- How to use it: Use it to identify delays caused by handoffs, batching, approvals, and unclear requirements.
Full breakdown here:
The Kanban Metrics That Often Mislead Teams
1) “Utilization” (How Busy Everyone Is)
High utilization sounds good, but it often increases waiting and slows delivery. When everyone is “100% busy,” there’s no capacity to handle urgent work, unblock others, or fix quality issues.
- Better alternative: Use lead time + WIP trends to manage flow and predictability.
2) “Hours Logged” or “Effort Spent”
Effort does not equal outcomes. Tracking hours can push teams to look productive instead of improving flow and finishing work.
- Better alternative: Throughput and lead time show what the system delivers.
3) “Cards Touched” / “Moves Per Day”
Moving cards is not progress. Sometimes excessive movement is a sign of rework, unclear definitions, or churn.
- Better alternative: Track WIP age and blocked time to see where work truly stalls.
4) Average Lead Time (Without Context)
Averages hide pain. One “easy” ticket can offset one painful, delayed ticket. Instead of only using averages, use percentiles (for example: 50th/85th/95th) to describe predictability.
- Better alternative: Use percentile lead times and aging thresholds.
5) Vanity “Green Dashboards”
If all your metrics are green but customers still complain about delays, you’re measuring the wrong thing—or measuring it the wrong way.
- Better alternative: Tie metrics to decisions: reduce WIP, fix a bottleneck, remove an approval loop.
How to Use Kanban Metrics Without Turning Them Into Micromanagement
To keep metrics healthy and useful:
- Measure the system, not individuals. Kanban is about flow across the workflow.
- Use a few metrics consistently. More metrics = more noise.
- Review metrics with the board visible. Numbers + visual workflow = fast root cause discovery.
- Always ask “What decision will we make?” If you can’t answer that, don’t track it.
A Simple Weekly Kanban Metrics Review (20 Minutes)
Here’s a lightweight routine you can run weekly:
- Check lead time trend: Is it improving or worsening?
- Check throughput trend: Is delivery stable, rising, or volatile?
- Check WIP and WIP age: What’s stuck? What’s too old?
- Check flow efficiency (optional weekly): Where is time being lost to waiting?
- Pick one improvement action: Reduce a queue, add a policy, tighten WIP, remove a handoff.
Do this consistently, and you’ll see measurable improvements without drowning in reporting.
Final Thoughts
Kanban metrics should make work clearer, not more complicated. If you focus on lead time, throughput, WIP, WIP age, and flow efficiency, you’ll have everything you need to improve predictability and delivery—without turning your team into a reporting machine.
Recommended next reads: