Kanban Metrics: What to Track and Why
Kanban metrics help teams see how work really flows—not how they think it flows. When you track the right numbers, bottlenecks become obvious, improvement becomes measurable, and delivery becomes more predictable. In this guide, you’ll learn the four essential Kanban metrics and how they work together to reveal the health of your workflow.
Why Kanban Metrics Matter
Many teams try to improve speed by pushing harder or starting more work. But Kanban takes a different approach: it exposes the hidden delays, queues, and inefficiencies slowing the system down. Good metrics help you:
- Spot bottlenecks early
- Predict delivery more reliably
- Reduce WIP and context switching
- Increase flow efficiency
- Shorten lead times without rushing
If you’re new to the concept of flow, review Continuous Flow: The Secret to Faster Work to understand why smooth flow is more valuable than raw speed.
The Four Core Kanban Metrics
While there are many advanced Kanban analytics, every high-performing team starts with the same four foundational metrics:
1. Lead Time
Lead time measures the total time from when work starts to when it finishes. It includes both active work and waiting time. The longer work sits waiting in queues, the longer lead time becomes.
Reducing lead time improves responsiveness and customer satisfaction. It also makes commitments more reliable.
2. Cycle Time
Cycle time tracks how long an item spends actively being worked on—from the moment someone begins work to the moment it’s completed.
Where lead time reveals system-wide flow, cycle time reveals how long focused work takes. Teams use it to:
- Estimate how long tasks of different sizes typically take
- Spot when certain types of work slow down
- Identify steps in the workflow that take too long
3. Throughput
Throughput is simply the number of items completed in a given time period—usually per week or per sprint. Throughput lets teams measure capacity based on real output instead of guesswork.
High variation in throughput signals that the system is unstable or overloaded. Stable throughput is a sign of a healthy flow system.
4. Work in Progress (WIP)
WIP measures how many items are currently being worked on. When WIP is too high, cycle time and lead time grow rapidly because work piles up in queues.
If you haven’t implemented WIP limits yet, read What Are WIP Limits? (And Why Most Teams Ignore Them) to understand why limiting WIP is the fastest way to speed up your system.
How These Metrics Work Together
Kanban metrics don’t exist in isolation—they form a connected system. Here’s how they interact:
- WIP ↑ → Lead Time ↑
- Lead Time ↑ → Predictability ↓
- Cycle Time ↓ → Throughput ↑
- Bottlenecks ↑ → Flow Efficiency ↓
If one metric moves sharply, the others usually follow. For example, when WIP increases, lead time and cycle time increase too, often dramatically. When teams stabilize WIP, throughput becomes smoother and more predictable.
Flow Efficiency: The Hidden Multiplier
One Kanban metric deserves special attention: flow efficiency. It compares active work time to total lead time and reveals how much of the team’s effort is being lost to waiting.
If you want to understand why work slows down even when teams feel “busy,” read Flow Efficiency Formula (Explained So Anyone Can Use It).
How to Start Tracking Kanban Metrics
You don’t need complex software to begin tracking these metrics. Most teams start with a simple board—physical or digital—and track a few basic timestamps:
- When work enters the system
- When work begins
- When work finishes
With these three moments captured, you automatically have lead time, cycle time, and throughput. WIP can be measured directly by simply counting the cards in progress.
To get the most accurate insights, track your workflow consistently for at least 4–6 weeks. Patterns will begin to emerge quickly.
Visualizing Metrics on a Physical Board
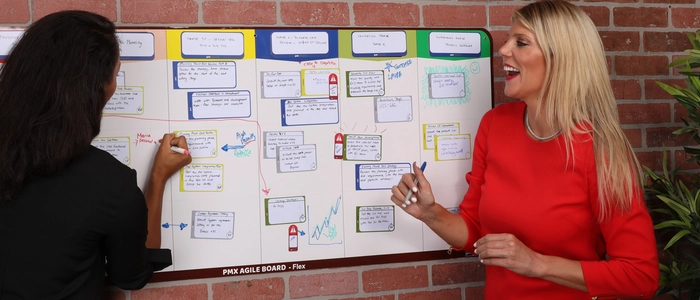
A physical Kanban board makes it easier for teams to see flow problems in real time. You don’t have to dig into dashboards—issues become visible at a glance:
- Columns with too many cards reveal high WIP
- Stale cards show bottlenecks or blockers
- Slow-moving columns signal cycle time issues
Teams meet at the board, discuss flow bottlenecks, and make adjustments based on real data—not assumptions. This turns metrics into daily habits rather than quarterly reports.
Product Tie-In: PMXBOARD Kanban Board Set
Tracking Kanban metrics is far easier when the workflow is visible. The PMXBOARD Kanban Board Set helps teams:
- Visualize work clearly
- Spot bottlenecks earlier
- Track WIP in real time
- Hold smoother standup meetings
If you want to improve flow using Kanban and Lean principles, a visual board gives you the clarity and discipline needed to make metrics meaningful.
Next Steps
Start by tracking just one metric this week—lead time or WIP is a great first step. Review the results with the team, look for patterns, and make one small improvement. Over time, these small refinements compound into a permanently faster, more predictable delivery system.