
Flow Efficiency Formula (Explained So Anyone Can Use It)
If work feels “busy” but results still arrive slowly, you’re probably losing time in the invisible place where most work gets stuck: waiting.
Flow efficiency is a simple metric that reveals how much of your total lead time is spent doing real value-added work versus sitting idle in queues, handoffs, approvals, or “waiting on someone.”
This article breaks down the flow efficiency formula in plain English, shows a simple calculation example, and then walks through practical ways to improve it — without adding headcount or working longer hours.
What Is Flow Efficiency?
Flow efficiency measures the percentage of time work is actively being worked on compared to the total time it takes to deliver it.
In other words:
- Active time (also called “touch time” or “process time”) = time spent doing the work
- Total time (lead time) = active time + waiting time + handoffs + delays
Flow efficiency is powerful because it exposes the true reason work takes so long: it’s usually not the work itself — it’s everything around it.
The Flow Efficiency Formula
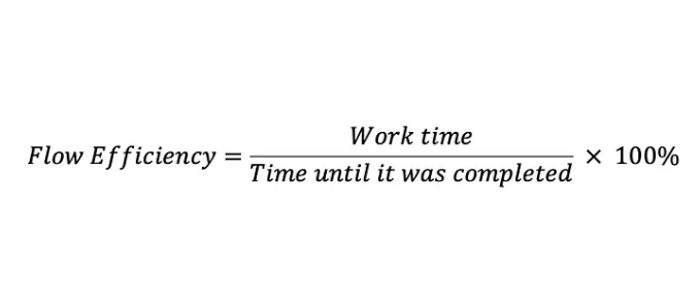
Here’s the basic formula:
Flow Efficiency (%) = (Active Time ÷ Lead Time) × 100
Where:
- Active Time = time spent actually working on the item
- Lead Time = time from “started/requested” to “delivered/done” (end-to-end)
A Simple Flow Efficiency Example (With Real Numbers)
Let’s say a task takes:
- 2 hours of actual work (active time)
- 5 days from start to finish because it waits in queues, gets reviewed later, and sits between steps
Convert to the same unit first (hours is easiest):
- Lead time = 5 days × 8 hours/day = 40 hours
- Active time = 2 hours
Flow Efficiency = (2 ÷ 40) × 100 = 5%
That means 95% of the time the work item wasn’t being worked on at all.
What’s a “Good” Flow Efficiency?
In knowledge work, flow efficiency is often surprisingly low — commonly in the single digits to teens. That’s normal, but it’s also a huge opportunity.
- 1%–10%: lots of waiting, heavy batching, too much WIP, slow reviews
- 10%–25%: decent flow, still likely queues and handoffs
- 25%+: strong flow (usually requires tight WIP limits and fast feedback loops)
The goal isn’t to hit a magic number — it’s to use the metric to find and remove delays.
How to Measure Flow Efficiency in Practice
You don’t need perfect data to start. You just need a consistent method.
Option 1: Simple Manual Measurement
- Pick a completed item
- Estimate active time (touch time)
- Measure lead time (calendar time from start to finish)
- Calculate the percentage
Do this for 10–20 items and look at the average.
Option 2: Board-Based Measurement (Highly Practical)
If you use a Kanban board, you can track:
- When the card entered “In Progress” (start)
- When it reached “Done” (finish)
- How long it sat waiting in each column (especially review/approval columns)
Even a rough time-in-column view quickly shows where the delays live.
Why Flow Efficiency Drops (The Usual Causes)
Low flow efficiency is almost always caused by one or more of these:
- Too much WIP (work piles up in queues)
- Batching (reviews happen once a week, releases happen monthly)
- Handoffs (waiting for another team or specialist)
- Unclear priorities (items stall because “what’s next?” changes daily)
- Bottlenecks (one constrained step delays everything behind it)
How to Improve Flow Efficiency (Without “Working Harder”)
Flow efficiency improves by reducing waiting time, not by speeding up people.
1) Reduce Work in Progress (WIP)
High WIP creates long queues — and queues create long lead times.
If you want the most direct lever, start here: tighten WIP limits, finish before starting, and stop flooding the system.
2) Shrink Batch Sizes
Large batches wait longer and create bigger delays at reviews, testing, approvals, and releases. Smaller batches:
- move faster
- surface problems earlier
- reduce rework
3) Attack the Biggest Waiting Column
On most boards, one column dominates time: “Review,” “Approval,” “QA,” “Blocked,” or “Waiting.”
Pick the worst one and improve it with:
- faster review SLAs (same day / 24 hours)
- clear acceptance criteria
- dedicated review time windows
- fewer handoffs
4) Identify and Protect the Constraint
If one step is overloaded, everything waits behind it. Find the bottleneck and:
- reduce demand hitting it
- feed it only the highest priorities
- remove distractions and task switching
5) Make Policies Explicit
Hidden rules create hidden waiting. Clarify:
- what “ready” means
- what gets expedited
- who approves what
- how blockers get resolved
A Fast “Reality Check” Exercise (10 Minutes)
Try this with your team:
- Pick one recently completed item
- Write down lead time (start → done)
- Estimate touch time (actual working time)
- Calculate flow efficiency
- Ask: “Where did it wait the most?”
Do this a few times and you’ll immediately see the system’s real problem areas.
Final Thoughts
The biggest productivity gains rarely come from people working faster. They come from work waiting less.
Once you can calculate flow efficiency with a simple formula, you can have better conversations about improvement — because you’re talking about system delays, not individual effort.
Related Articles
- Flow Efficiency: The Metric That Shows True Productivity
- Little’s Law Explained: Why Flow Is Predictable