What Is Visual Factory? (Beginner Lean Guide)
A Visual Factory is what happens when your workplace “tells the truth” at a glance.
Instead of hiding problems in spreadsheets, meetings, or dashboards, a Visual Factory uses visual management—signals, boards, markings, and standards—to make performance, flow, and abnormalities obvious in real time. In Lean terms, it helps you see waste, fix issues faster, and keep teams aligned every day.
Visual Factory Definition (Simple)
A Visual Factory is a work environment where:
- standards are visible
- status is visible
- problems are visible
- next actions are visible
If someone walks into the area (even a visitor) and can understand what’s happening within a minute or two, you’re moving toward a Visual Factory.
Why Visual Factory Works
Most operational pain comes from invisible issues: unclear priorities, unclear ownership, unclear status, unclear standards. Visual Factory practices solve that by turning information into a shared visual language.
When visibility improves, teams typically see:
- faster response to abnormalities
- less rework because standards are clearer
- less firefighting because bottlenecks show up sooner
- higher accountability because ownership is visible
- stronger daily alignment without constant meetings
Visual Factory vs Visual Management
Visual management is the method (tools + signals). A Visual Factory is the environment you create when those methods are applied consistently across daily work.
Think of it like this:
- Visual management = the system
- Visual Factory = the culture + workspace that system produces
The 5 Core Elements of a Visual Factory
1) Visual Standards
Standards remove ambiguity. Make them visible and usable where work happens:
- standard work instructions at point-of-use
- quality checklists
- “definition of done” posted near boards
- labeled locations for tools/materials
2) Visual Status (Real-Time)
Status should never require a login, a report, or a meeting. Examples:
- daily KPI boards
- production tracking charts
- Kanban boards showing WIP and flow
- project boards showing milestones and blockers
3) Visual Abnormalities
In Lean, the goal is not “no problems.” It’s “problems surface instantly.” Abnormality signals include:
- red/green status markers
- blocked-task indicators
- andons / escalation signals
- work aging highlights (anything stuck too long)
4) Visual Flow
Flow answers: “Where is work right now, and what’s next?” This can be done with:
- Kanban columns
- swimlanes for priority classes or work types
- pull signals (when to start, when to stop)
- simple WIP limits
5) Visual Ownership
When ownership is unclear, work stalls. Make ownership visible:
- task cards with owners
- area ownership boards
- leader standard work checklists
- clear escalation paths
Common Visual Factory Tools (Beginner List)
- KPI boards (daily metrics + actions)
- Kanban / project boards (work status + priorities)
- Shadow boards (tools have a labeled home)
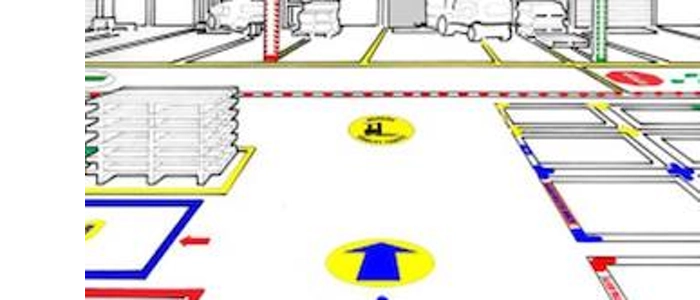
- Floor markings (material zones, walkways, safety)
- Standard work sheets (step-by-step, at point-of-use)
- Color coding (priority, status, category)
- Escalation signals (help needed, blockers, defects)
How to Start a Visual Factory (Step-by-Step)
Step 1: Pick One Area (Don’t Boil the Ocean)
Choose a team, cell, line, or office process where delays or confusion are common. The best pilot areas usually have:
- frequent handoffs
- visible pain (missed deadlines, rework, bottlenecks)
- a willing leader
Step 2: Define What “Good” Looks Like
Answer these clearly:
- What should be happening daily?
- What standards matter most?
- What KPIs define success?
- What’s the normal condition vs abnormal?
Step 3: Make Status Visible (Daily Board)
Create a simple board that shows:
- today’s priorities
- current work-in-progress
- key KPIs (a few, not twenty)
- problems / blockers
- next actions + owners
Step 4: Add One Abnormality Signal
Start with a simple rule like:
- Any task blocked > 24 hours gets a red marker
- Any metric off-target triggers an action owner
- Any work item aging past a threshold moves to an “Escalate” lane
Step 5: Review Daily (Short, Consistent)
A Visual Factory only works if it’s used. Keep the routine short:
- 5–10 minute daily huddle
- review KPIs + blockers
- assign actions
- update the board live
Common Mistakes to Avoid
- Making it decorative. If it doesn’t drive action, it’s wallpaper.
- Tracking too many metrics. Keep it focused and decision-oriented.
- Updating once a week. Visual Factory is daily visibility.
- No defined “abnormal.” If everything looks fine, problems stay hidden.
- No owner. Boards without ownership become abandoned quickly.
Final Thoughts
A Visual Factory is one of the fastest ways to improve alignment, speed, and problem-solving—because it makes reality visible. When teams can see standards, status, flow, and abnormalities at a glance, they spend less time chasing information and more time improving outcomes.
Related Articles
- A3 Problem Solving: Step-by-Step Beginner Guide
- Root Cause vs Symptom: How to Think Like an Improver